Excel Export provides a way to export grid data as an Excel table, which would instantly enable the user to filter, sort, and analyse the data in Excel. You can instruct AG Grid to automatically create an Excel table containing the grid data when exporting to Excel.
Exporting Excel Tables Copy Link
In order to create an Excel table for the exported data, you should set the exportAsExcelTable property in the ExcelExportParams configuration object. Excel config parameters can either be set in the defaultExcelExportParams Grid Option or passed as an argument to one of the Excel export API methods.
<ag-grid-angular
[defaultExcelExportParams]="defaultExcelExportParams"
/* other grid options ... */ />
this.defaultExcelExportParams = {
exportAsExcelTable: true,
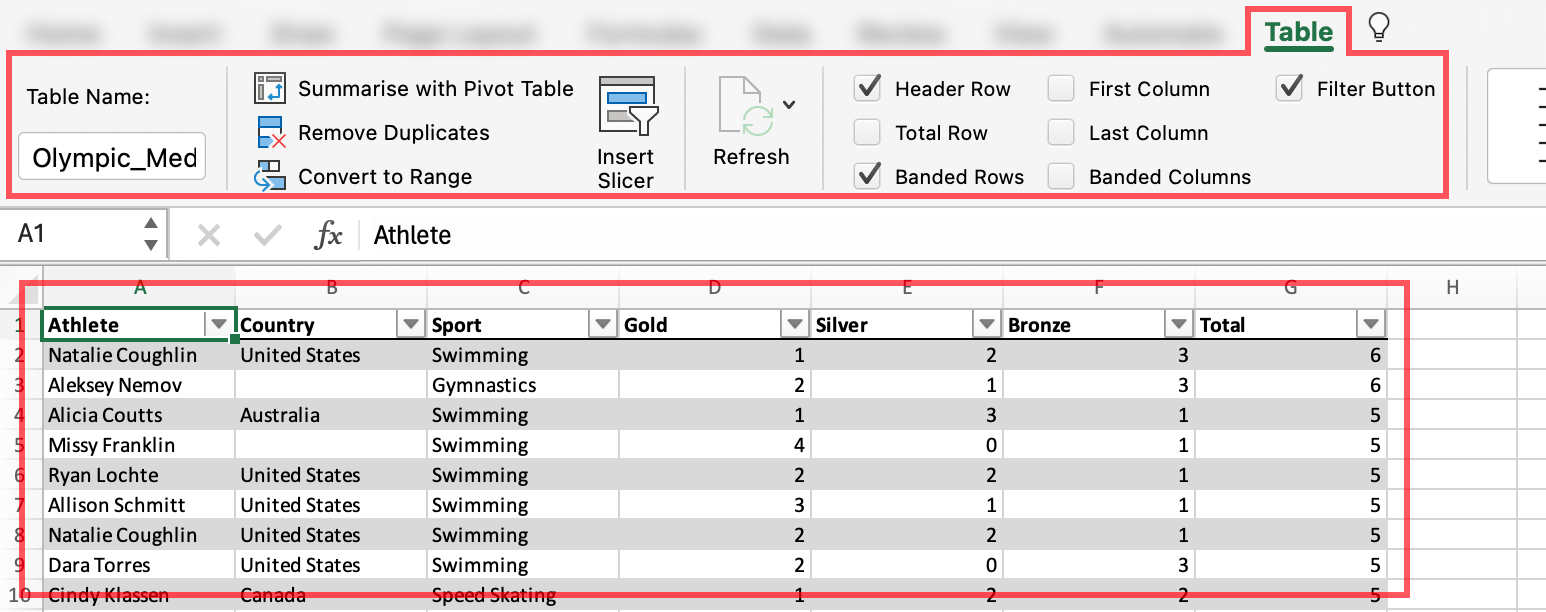
};The exported Excel file will contain a sheet with a table enclosing the exported data. When you select a cell within the table, the Table tab in the Excel tabs toolbar will appear, which provides options to filter, sort, and analyse the data.
This is how the exported Excel file with Table looks when opened in Excel:
Exporting a Sheet as Excel Table Copy Link
The following example demonstrates how to export the grid data as an Excel table.
- We set the
exportAsExcelTableproperty totruein thedefaultExcelExportParamsGrid Option.
Proceed as follows to see the Excel table:
- You can trigger the export by clicking the
Export to Excelbutton or via context menu. - Once your file is exported, open it in Excel and select a cell within the table to see the
Tabletab. - This example includes grouped columns, and thus only the leaf columns are included in the Excel table.
- In this example, only Athlete, and Country columns can be filtered. This is also reflected in the Excel table.
Customisation Copy Link
You can customise the Excel table by providing a config object instead of a boolean value for the exportAsExcelTable. This config object can contain the following properties:
Properties available on the ExcelTableConfig interface.
This property is used to set the table name. It should be an alphanumeric string with no special characters. |
Set this property to false to disable the filter button at the exported Excel table header. Set it to true to show the filter button on all columns. Set it to match to show the filter button only if the column has a filter allowed. |
Set this property to false to hide the row stripes. |
Set this property to true to show column stripes. |
Set this property to true to show the first column in bold/highlighted style. |
Set this property to true to show the last column in bold/highlighted style. |
Excel tables require non-empty and unique table column names. When exporting your Grid as an Excel Table, you should ensure that the column headers are all unique and not empty.
This is equally applicable when using processHeaderCallback to customise the column headers.
If you have duplicate column headers, Excel will display a warning message when the exported file is opened. Excel will sometimes suggest to fix the issue automatically (by renaming the invalid table headers). However, this is not always the case, and the user may end up with a table that doesn't work as expected.
Please note that exporting to an Excel table isn’t supported for pivot and for master/detail grids. The grid will be exported without an Excel table format.
Row / Column Stripes and Filter Buttons Copy Link
In the following example, we customise the Excel table as follows:
showRowStripes- Set totrueto show row stripes in the Excel table.showColumnStripes- Set totrueto show column stripes in the Excel table.showFilterButton- Set totrueto show filter buttons for all columns in the Excel table.name- Set toOlympic Medalsto name the Excel table.
Proceed as follows to see the Excel table:
- Click the
Export to Excelbutton to export the grid data as an Excel table. - Open the exported file in Excel and select a cell within the table to see the
Tabletab. - Notice that the stripes are only applied to the columns of the table.
- Notice that the table name is set to
Olympic_Medals. - Notice that the filter buttons are available for all columns in the table.
Highlighting the First and Last Columns Copy Link
In the following example, we customise the Excel table as follows:
highlightFirstColumn- Set totrueto highlight the first column in the Excel table.highlightLastColumn- Set totrueto highlight the last column in the Excel table.
Proceed as follows to see the Excel table:
- Click the
Export to Excelbutton to export the grid data as an Excel table. - Open the exported file in Excel and select a cell within the table to see the
Tabletab. - Notice that the
Athleteand theTotalcolumns are highlighted in the table.